The t Statistic--Single Sample
I. Introduction
A. t-statistic is a substitute for z
- to use z, you must know s
- what do you do if you don't know s ?
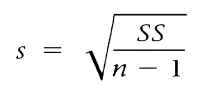
- t statistic allows you to use sample standard deviation - s - instead of s

Remember:
![]()
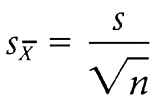
- then compute estimated standard error
 or
or

- Finally ready to use t statistic instead of a z statistic (very similar formula)

- Rule - When you know the population standard deviation use z, otherwise use t instead
B. Degrees of Freedom
- df = n - 1
- the greater n is, the more similar s represents s then the better t represents z
C.
t distribution

- generally not normal - flattened and stretched out
- approximates normal in the way that t approximates z
- shape determined by df


II. Hypothesis Testing with t statistic
A. Formula


B.
Steps (just like z)

Try this:
A psychologist would like to determine whether there is a relation between depression and aging. It is known that the general population averages m= 40 on a standardized depression test. The psychologist obtains a sample of n = 36 individuals who are over the age of 70. The average depression score for this sample is M = 44.5 with SS = 5040. On the basis of this sample, can the psychologist conclude that depression for elderly people is significantly different from depression in the general population? Use 2-tailed test at the .05 significance level.